Monitoring Overview
- Core Features
- Alerting Features and Notification Channels
- Status, Performance and Availability Features
- Error Analysis
Core Features
Montitor Anything
Wide Range of Checks supported:
Http, Https (content validation, custom ports), SSL Certificate Validation (Expiry, Issuer, Hostname, ...), DNS (A, MX, NS, CNAME, PTR, SOA, Blackhole List), Pop3, Smtp, Imap, Ftp, Ssh, Nntp, Tcp, Udp, Ping, Snmp, ...
Every Minute
By executing Checks every single minute, you will be ensured to detect any failure or outage as soon as possible.
This makes it possible to be informed as soon as any problem occurs and to minimise the reaction time to fix the issue!
Worldwide Locations
By monitoring from a global Network of monitoring Locations, false Alerts caused by any single Location Problem can be exluded.
Spreaded monitoring Locations add valuable indicators to Performance Figures of services! Pick the Locations you want to monitor from by yourself!
Email, Sms, Rss & Web Request Notifications
Be notified as you prefer.
Email Notifications and cheap worldwide SMS are supported as well as Rss Feed Alerts of your checks.
If you need to deal yourself with Alerts or if you want to get the most out of every Data, each Notification can result in a Web Request against an Url of your choice.
You could transfer all Notifications into your infrastructure as well as issue Alerts yourself and have all Data available for inhouse Analysis and Reporting!
Availability Reporting
Is it key for your Business to achieve a certain Availability?
Measure your Availability on Check Level as well as across all services as total Availability. Email Reports and graphical Visualisation available.
No Installation
No Software installation needed. No Requirements on your side such as Operating Systems or Runtimes. After your purchase, you can start right away!
Easy Configuration
Less is More! Configuring your Checks is easy and can be done within Seconds. If you have specific, detailed requirements, you can digg into more Options though.
Ready in Minutes
After Sign Up, you can configure your first check immediatly! During Setup, it's possible to test all Settings, see the Check Response and Output such as Success or Failure.
Alerting Features and Notification Channels
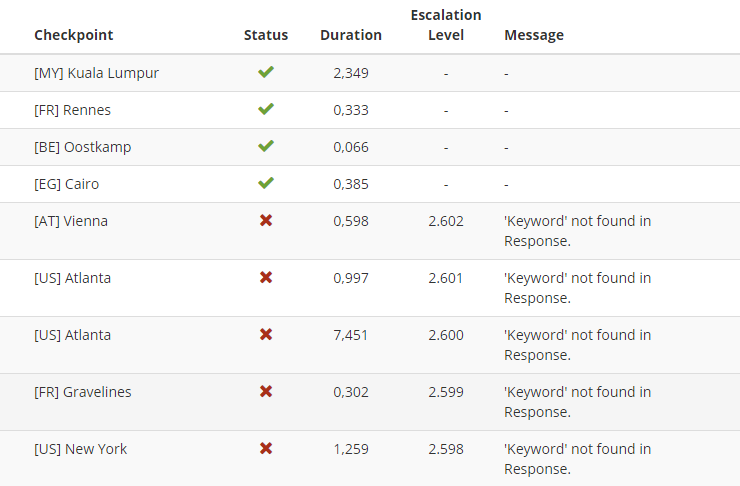
Fast Alters
Supported Escalation Settings include a First Threshold (how many failures occure, before an Alert is sent), a Last Threshold (how many failures occure, after no Alert is sent anymore) as well as an Interval (how often an Alert is sent). These Settings ensure Maximal Customisation and enable You to Minimise False Alarms (e.g. due to weak Connections of a Service). Unlimited Notification Groups and Members supported. Independent Escalation Configurations for every Group!
Notification Channels
Email and Worldwide SMS Notifications will report Alerts (Check Failures) and Recoveries (Check Successes after a Failure State). Rss Feed for all Notifications available as well! All Reports can be sent to your WebSite/Infrastructure as Web Request (HTTP GET), to Enable your own Reporting, Analysis and Statistics!
Maintenance Mode
With one Click, pause Checks from being executed and stop Alert Notifications from being sent in Case of Maintenance or similar reasons.
Status, Performance and Availability Features
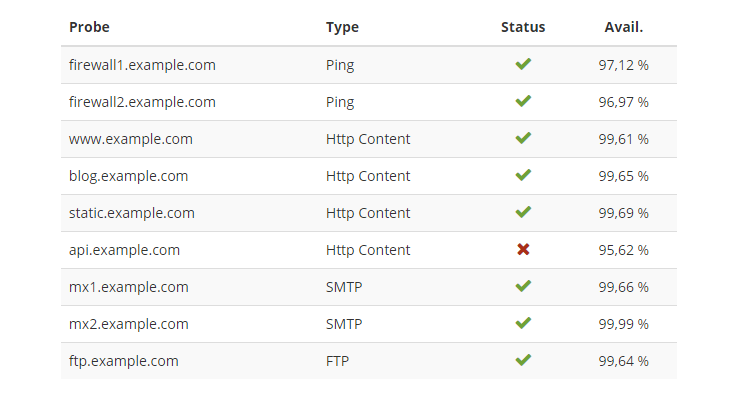
Status Overview
In order to keep the Big Picture accross all Checks, the Status Page lists all Checks with their most recent Data, upcoming Execution Time and much more. This Cockpit Page is capable of Filtering your checks, to ensure fastest access to all Checks, Data and Configuration!
Performance Reporting
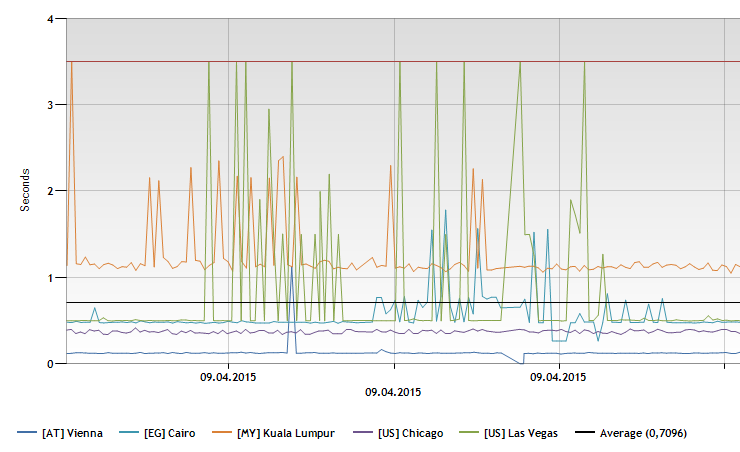
Performance is important, even more is Performance Reporting. To get a clear Picture, Request- and Response Time Duration Reports are available for every Monitoring Location as Graphs, with Averages and 95th Percentile figures.
Availability Reporting
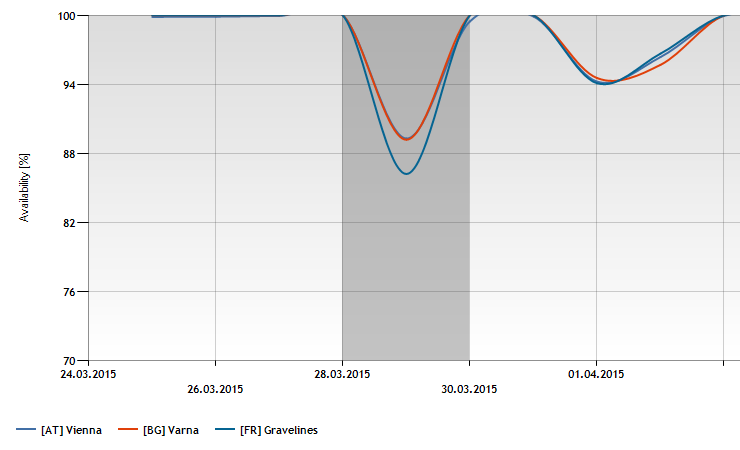
Availability is a Key Performance Indicator for a lot of People. Measurement and Visualisation of your Systems Availability is supported by Availability Graphs for Every Check as well as Weekly Email Reports at Service Level and as Overall Summary. At any time you can easily reset Availability Calculations and Recordings without losing other Data such as Performance Data or Error Logs! Is yours 99,99%?
Error Analysis
Graphical Error Reporting
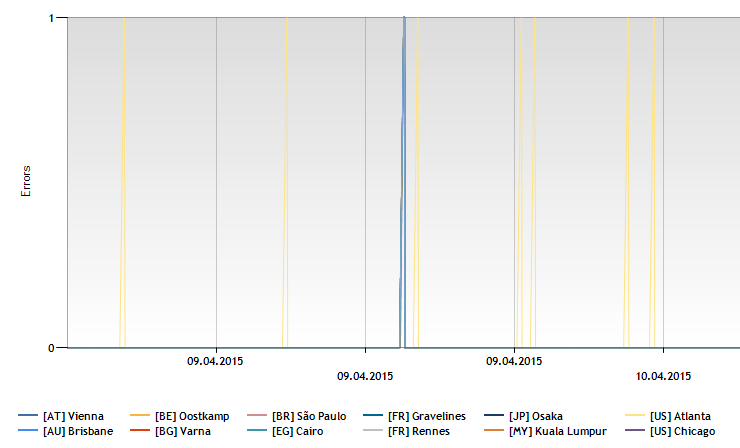
To get a grip on the amount of Errors occurring - which might not cause an Alert all the time due to Thresholds set - Error Statistics are provided as Graphical Reports containing each and every Location with a distinct Line Colour.
Error Logs
Error Analysis made fast and easy: In Case of a failing Check the very same Response is provided within the Error Log. Every Check has its own Error Log what makes it very convenient and fast to look at the cause of a failing Check!
